
OpsQI Work management and service desk, on one platform.
OpsQI is two products: Work Management and Service Desk. It runs projects, customer requests and cost in one place; AI works inside the work itself, in chat, in the daily brief and in reports.
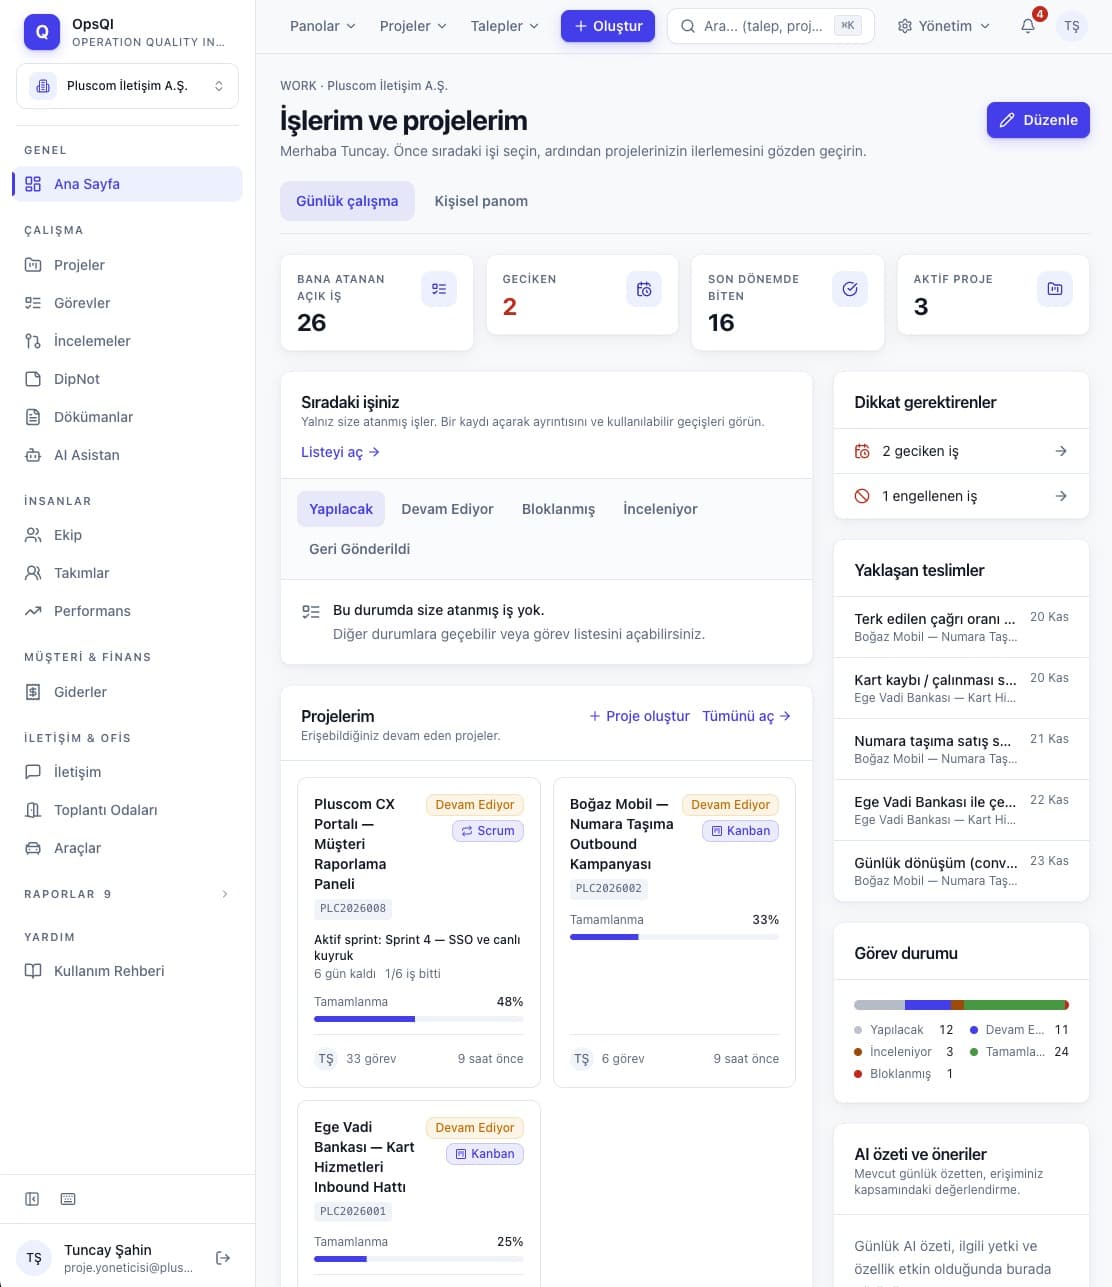
Product images are taken from the presentations in our promotional catalogue.
Who uses it
Used by teams that run projects, handle customer requests and want to track cost; it is not only for software teams. Managers, team leads, support agents and members work on the same platform, each seeing only their own scope, while customers use the portal.
What problem it solves
When tools are scattered, risks surface late. Tasks live in one tool, customer requests in another and cost in a spreadsheet; nobody sees the whole picture at once. Missing scope and vague acceptance criteria show up at delivery, weeks after the time is spent. Hours, expenses and meeting time sit in different places, so profitability is discovered at period end. A customer request has no link to the work that fixes it: the customer asks the agent, the agent asks the developer. OpsQI brings two products, Work Management and Service Desk, together on the same users, permission model, automation and AI layer.
One platform, different questions
OpsQI has a six-level role model: executive, department manager, team lead, project and quality manager, member and viewer. Everyone sees only their own scope.
Executive
The executive summary shows the whole portfolio on one page. The daily brief, ready every morning, sums up the events of the day, visible work status and recommendations.
Department manager
Follows cost per department, workload per person and team, and burnout warnings. The performance score goes through manager approval, and employees can appeal.
Team lead
Sees overdue work and deadline warnings on the management radar. In the service desk, asks the assistant where the queue hurts and gets concrete steps citing request keys.
Project and quality manager
Follows project health refreshed daily, SPI and CPI, and sprint risk. The task description quality score and the drift signal show the gaps before work starts.
Support agent
Takes over a request without reading the whole thread: for every request there is a short summary stating the decision made and the pending step.
Customer
Raises a request through the portal or by email and follows its status; can find the answer in the knowledge base and sees the support pack balance.
Two products, one platform
See risk early
The management radar gathers overdue work, project health and deadline warnings on one screen. Project health is reassessed every day; SPI (schedule performance index) and CPI (cost performance index) show schedule and cost performance together.
- The system scans in the background every day; managers hear before problems grow.
- Signs of burnout and people without assigned work become visible.
- Open workload per person and team can be read at a glance.
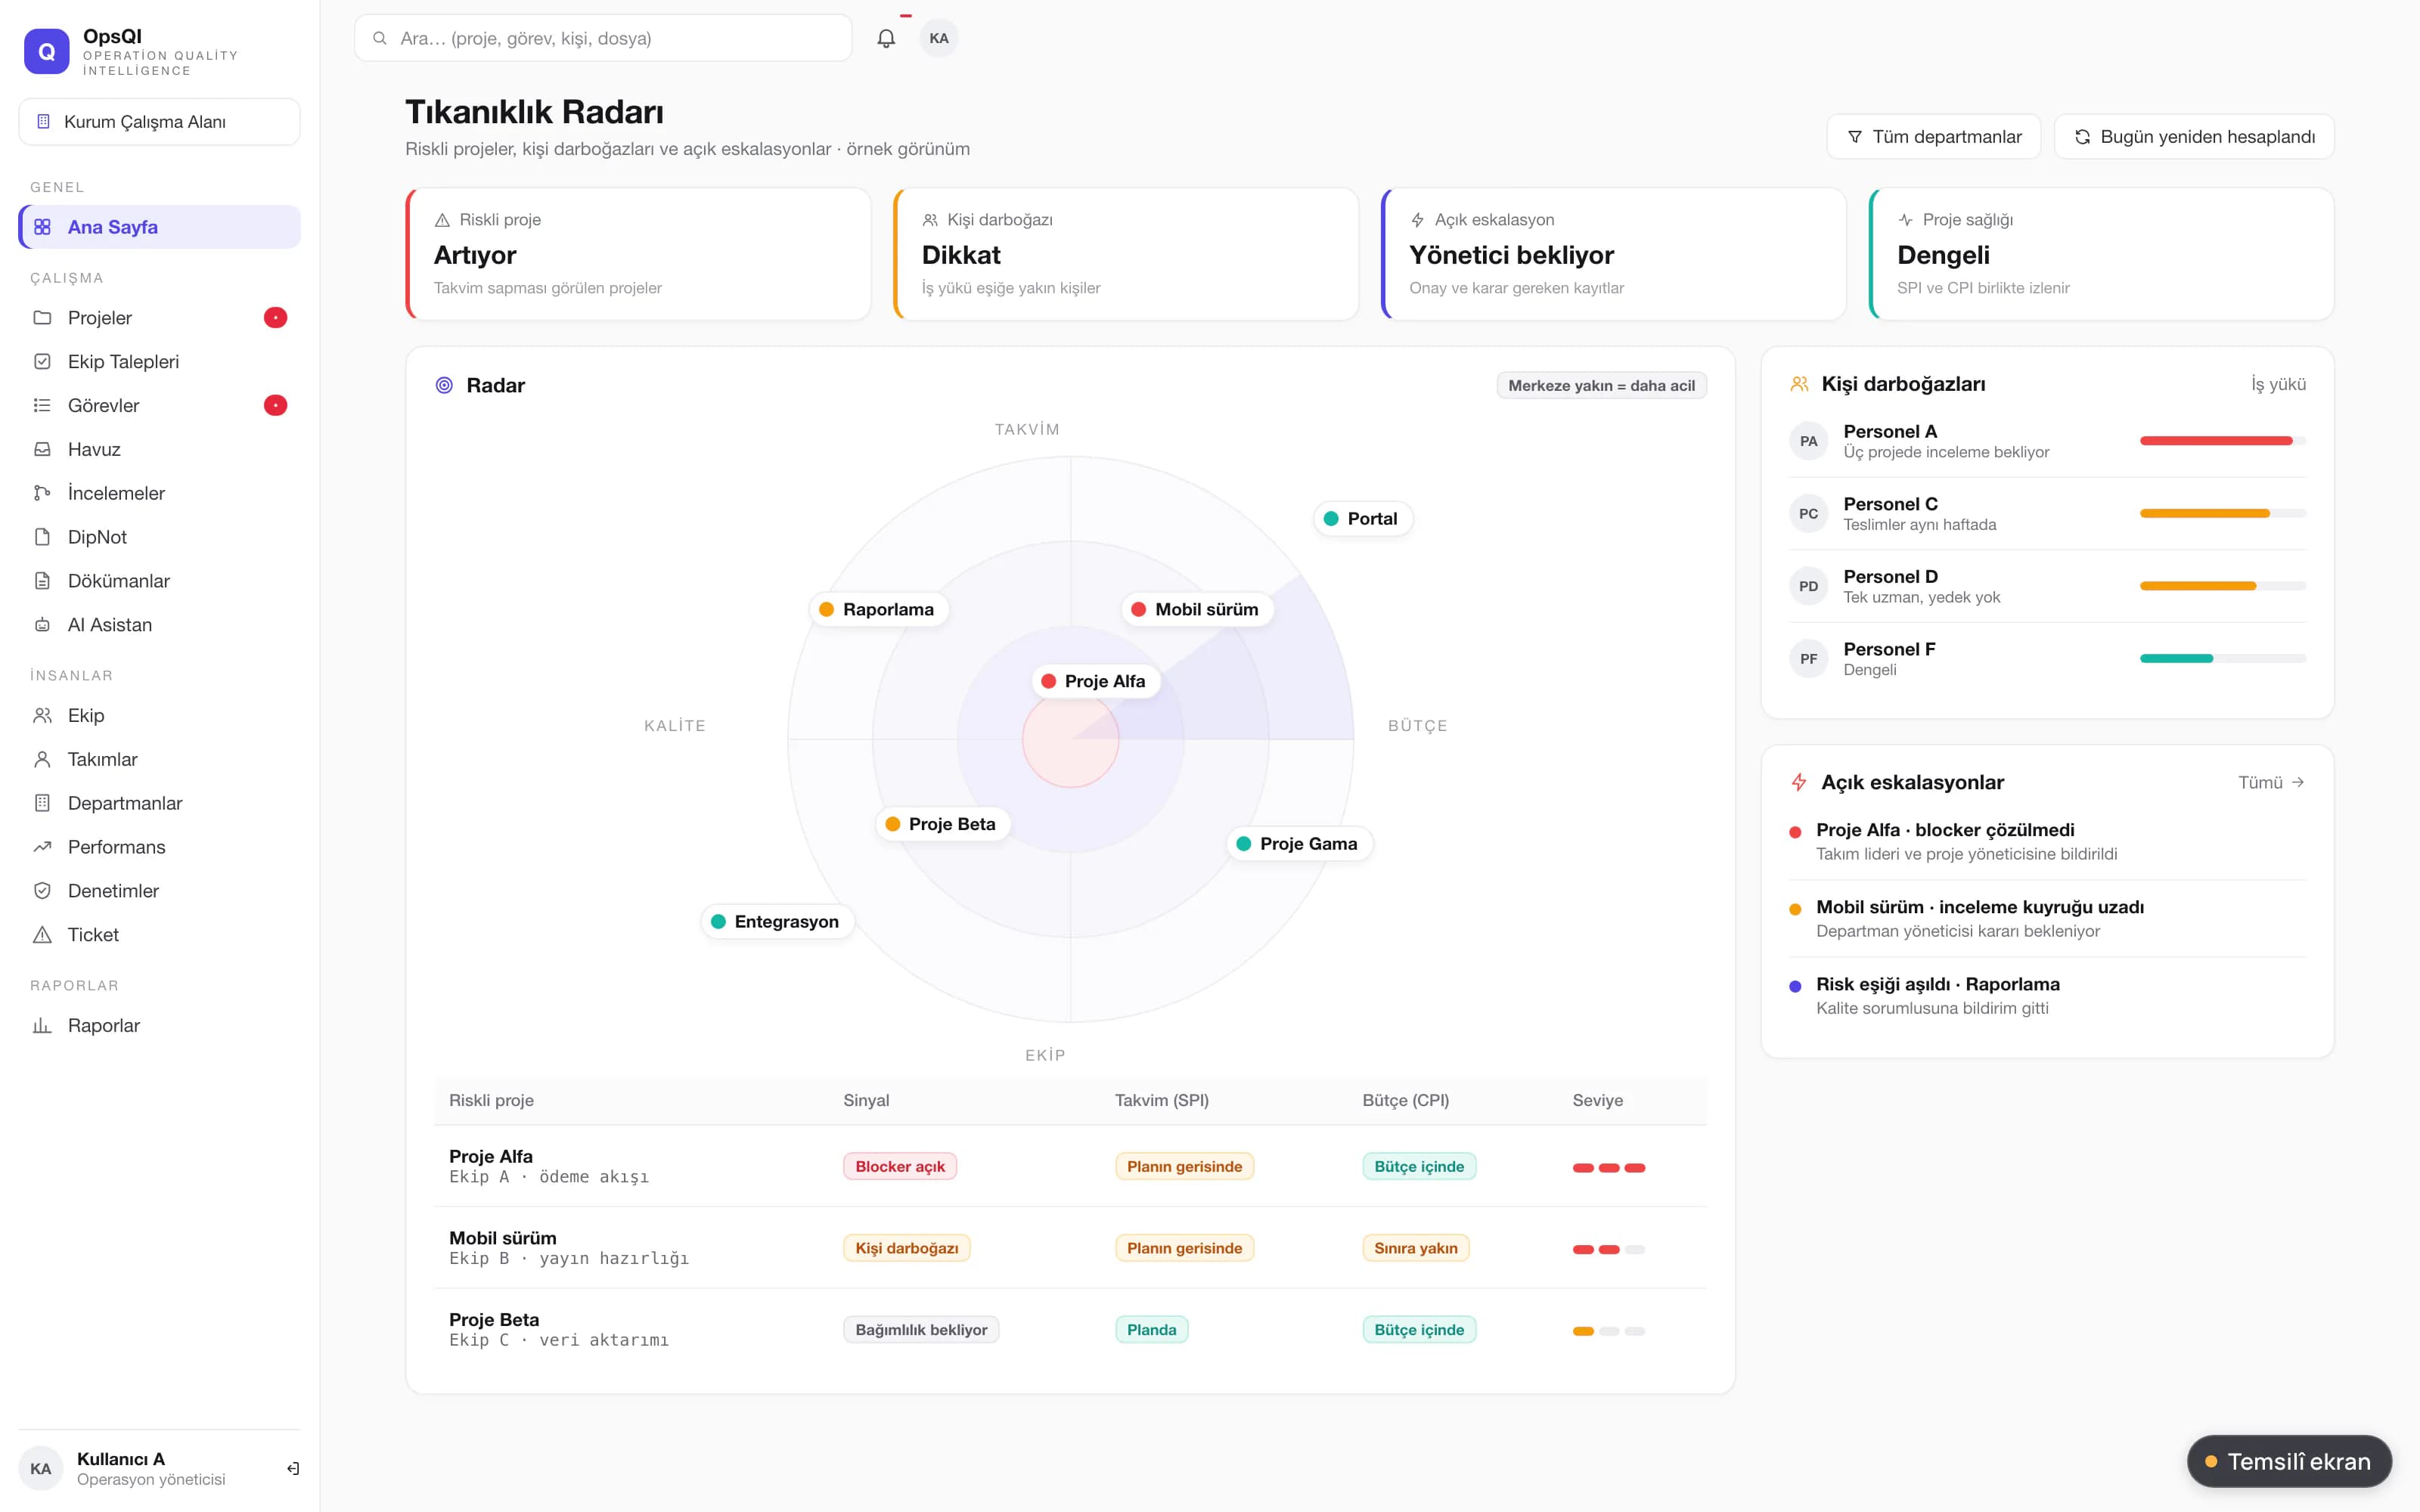
Illustrative screen Bottleneck Radar. At-risk projects, people bottlenecks and open escalations. Tasks are assessed as they are written
Every task is analysed in the background. Description quality is scored out of 100: clarity, acceptance criteria, scope and context, 25 points each. The result shows on the task as a badge and a short note, so gaps are closed before work starts.
- AI verdict: approve, object or reject.
- The drift signal is green, amber or red; it catches impossible dates, priority inflation, workflow violations and semantic drift.
- Similar bugs are suggested; a person always confirms the link.
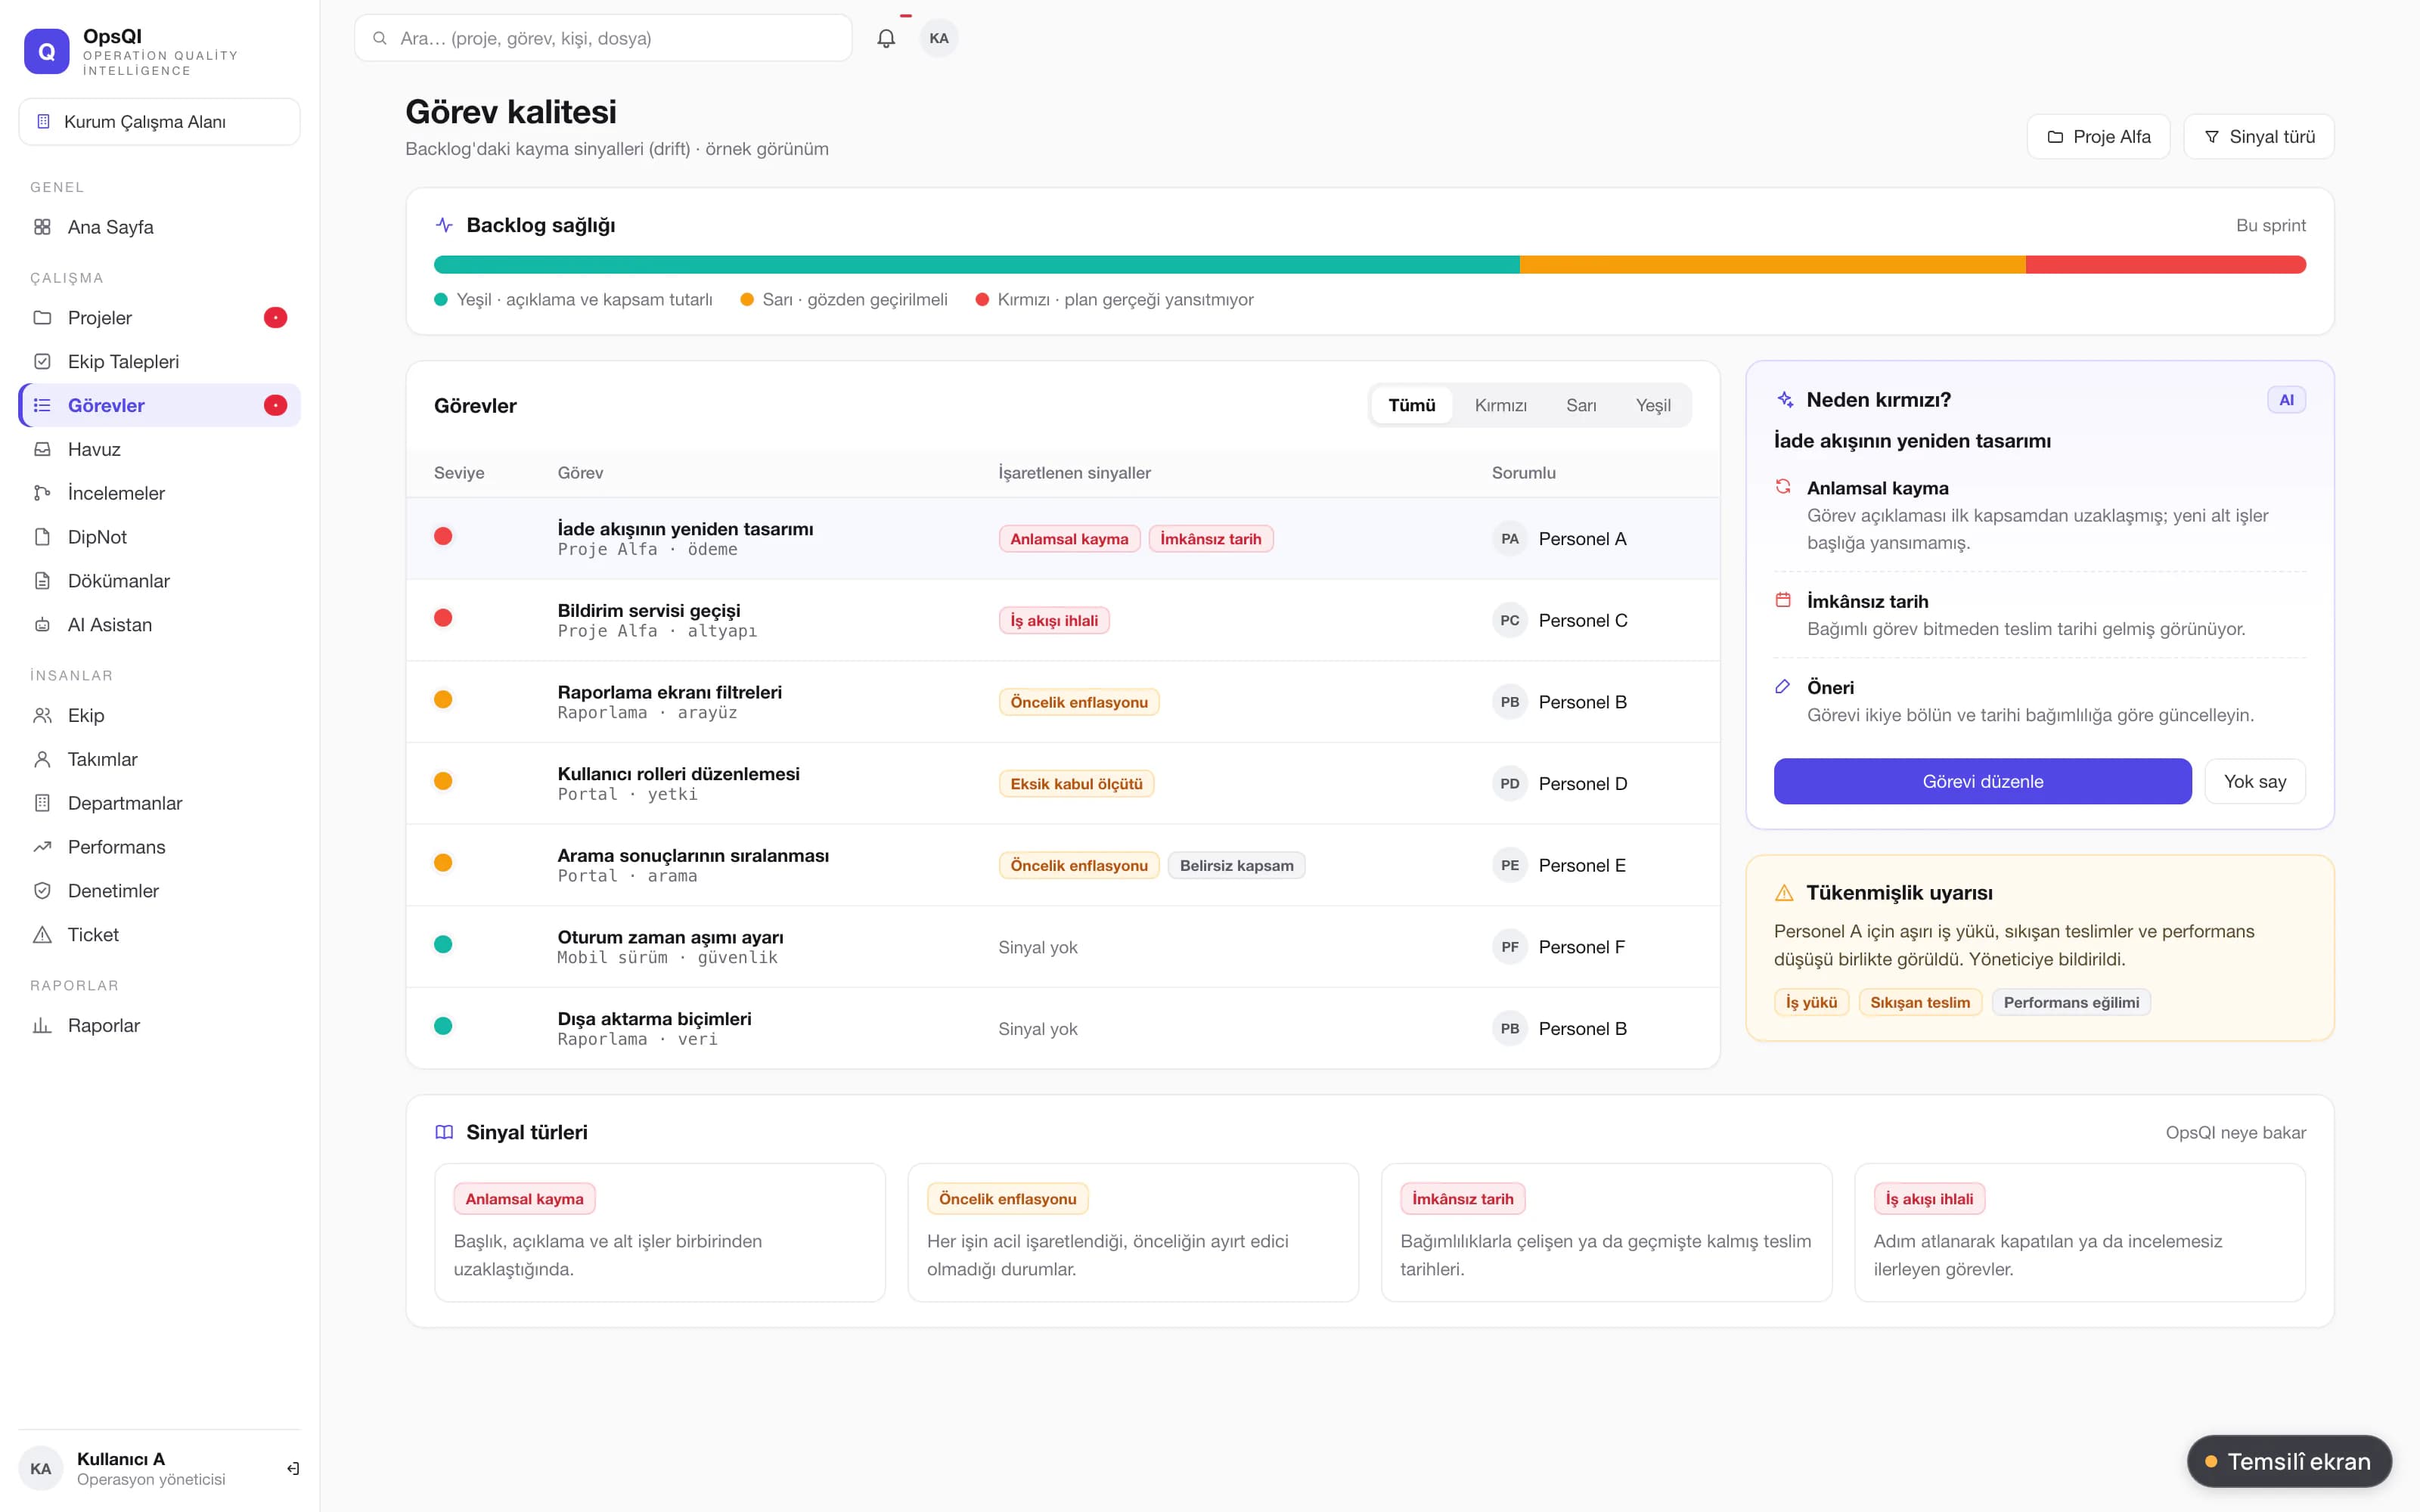
Illustrative screen Task quality (drift). Signal types marked green, yellow and red in the task list. An AI reviewer on every pull request
Connect your repositories; every pull request (PR) is reviewed automatically and findings appear alongside the related task. GitHub and GitLab cloud accounts and self-managed GitLab are supported.
- Findings are listed with severity, file and line.
- Reviews run with the AI credential configured for your workspace.
- Findings feed the quality and velocity reports over time.
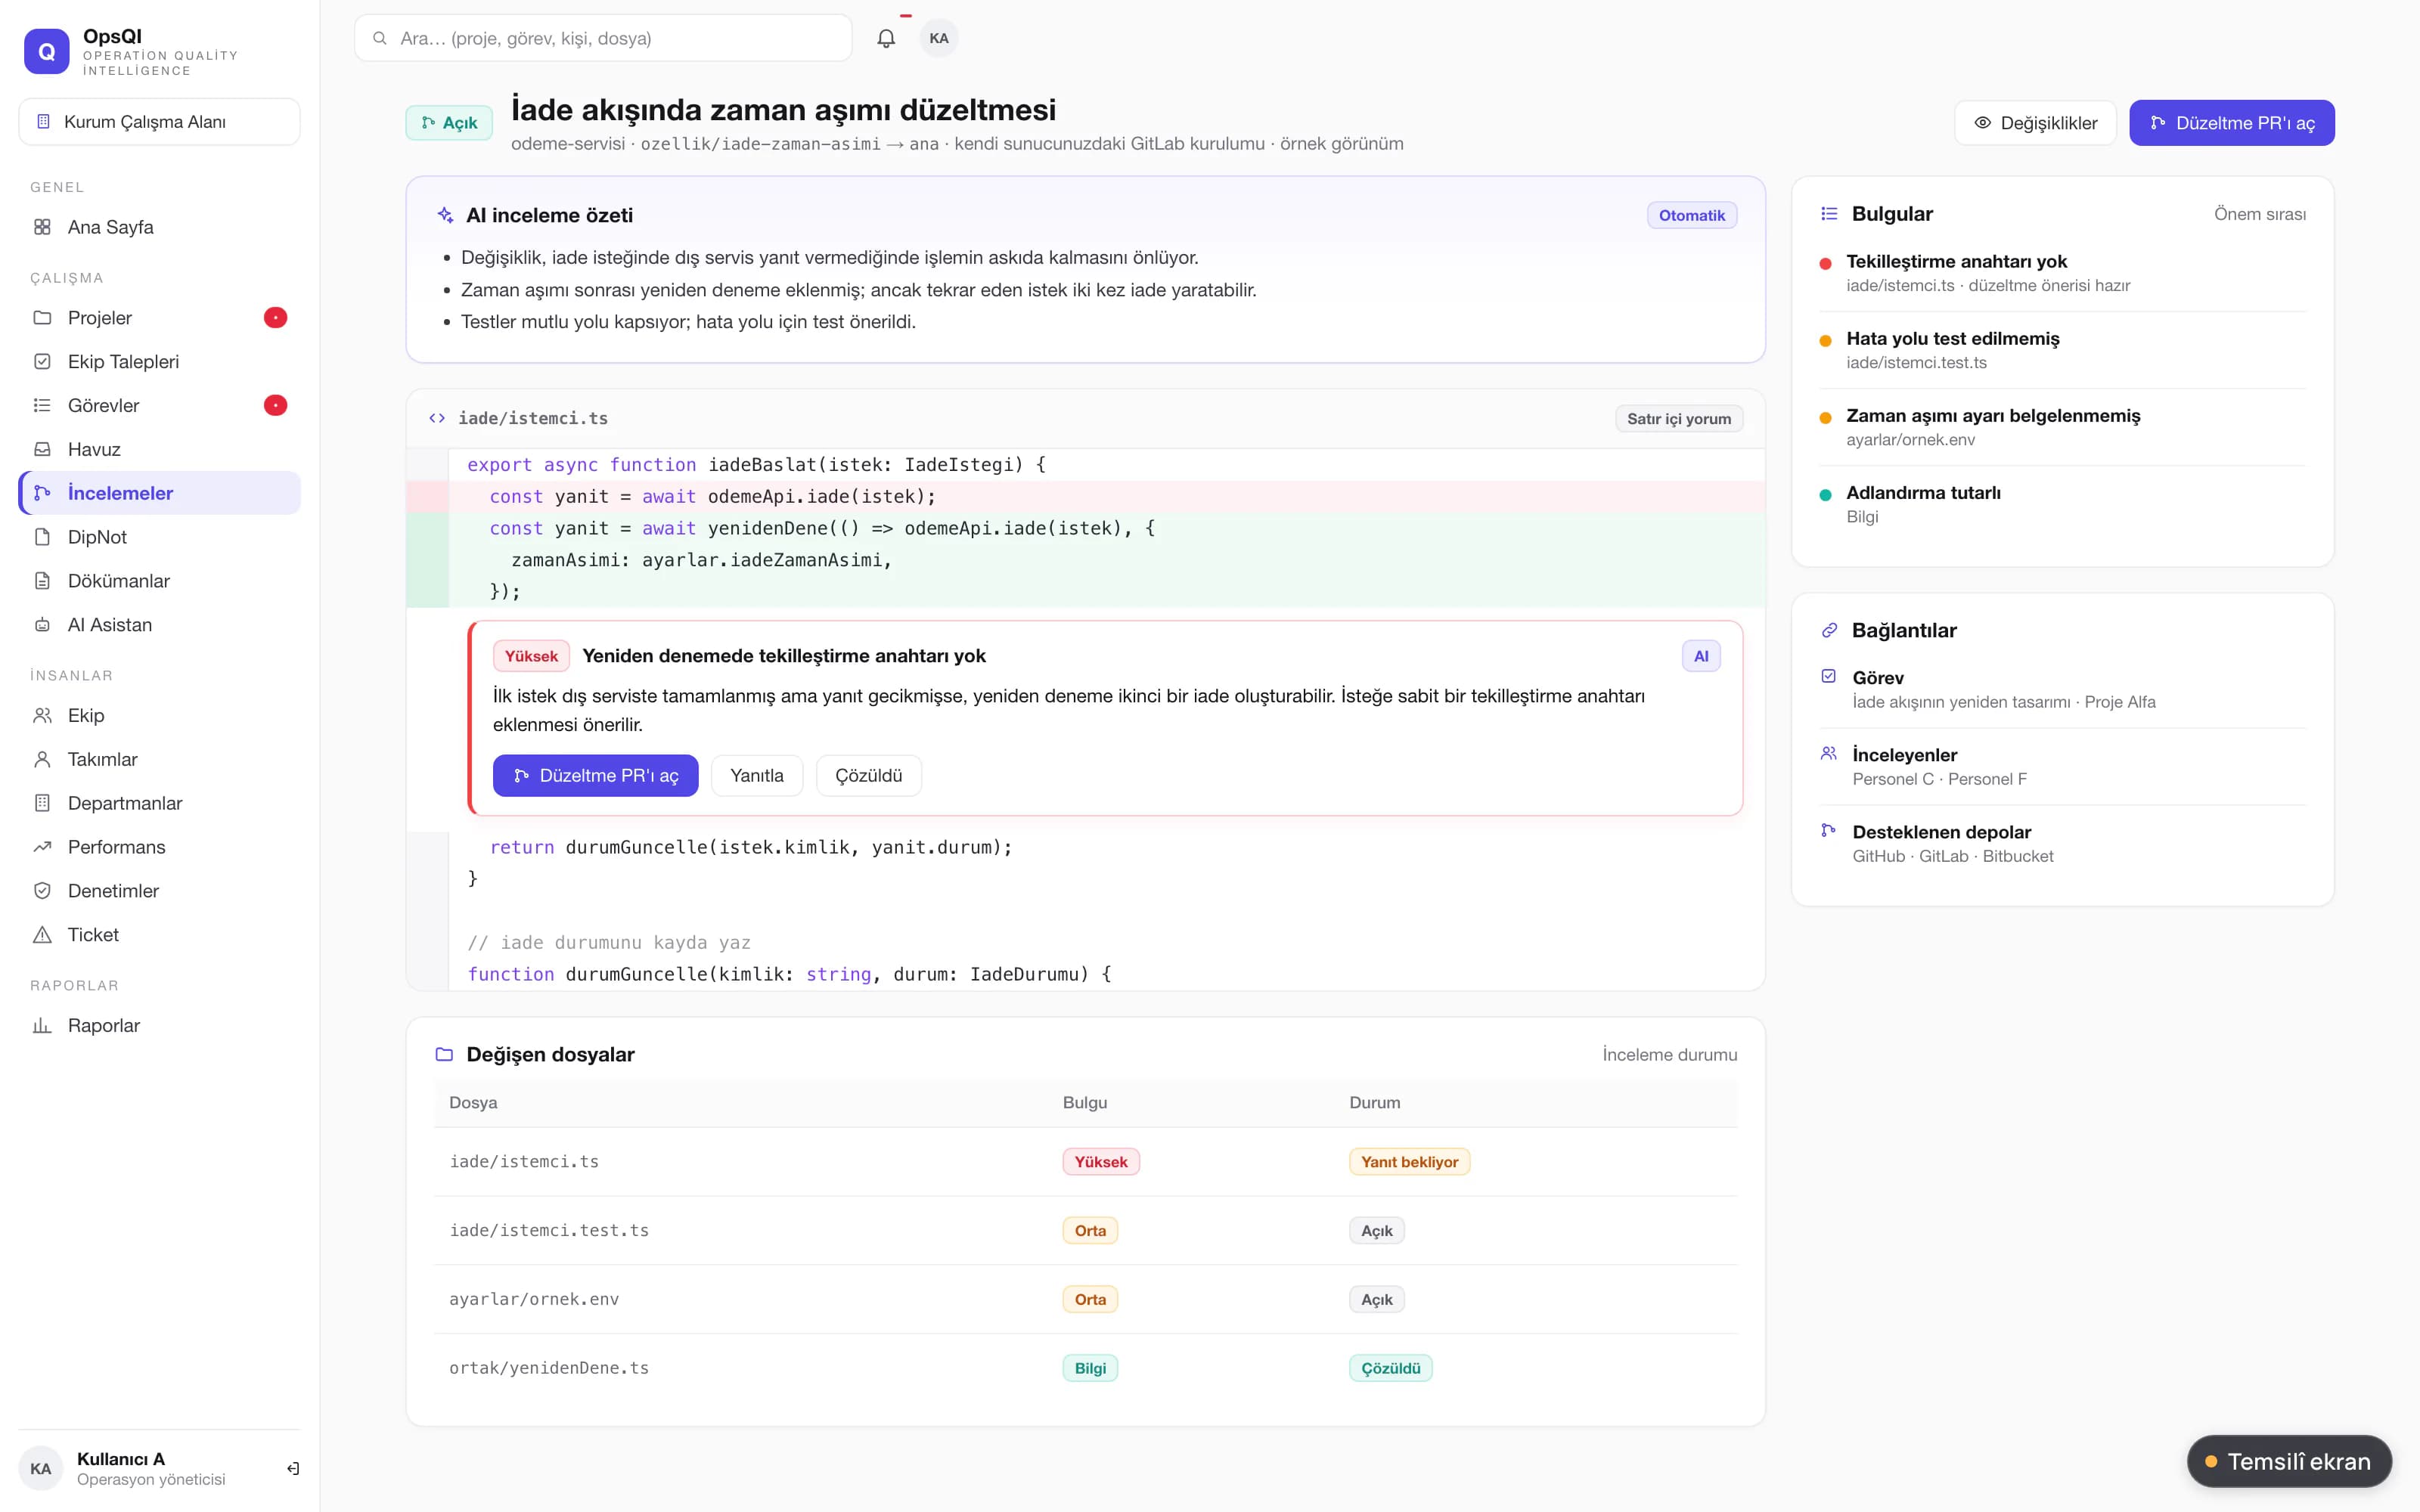
Illustrative screen AI code review. PR summary, inline finding card and the button for opening a fix PR.
Service desk
OpsQI is not only a work tracking tool: customer-facing support runs on the same platform. A request arrives through the portal, by email or raised by an agent; it lands in a queue, is assigned and resolved, and the customer gives feedback. Statuses, queues and workflow come ready with the first desk.
- Channel: portal form, email or raised by an agent
- Resolution records the workflow transition and the resolution reason
- You can receive your first request minutes after setup
Customer portal: your brand, your domain
Your customers raise and follow requests in a portal on your own domain, and find their own answers in the knowledge base. The logo, banner and accent colour are yours; emails carry the same look.
- Dynamic forms per request type: fields, required rules and presets
- Organisations: a customer can belong to several organisations; organisation admins manage their own members
- Portal users are fully separate from staff accounts; internal notes never reach the portal
The fast path from queue to resolution
Queues are saved queries; a team that knows the query language writes its own queues on day one. Internal notes and customer replies are separate, so nothing leaks by accident. For every request there is a short AI summary stating the decision made and the pending step.
- Canned responses, watchers, similar requests and bulk actions
- Incoming mail becomes a request, replies become comments
- Queue insights: unassigned, waiting over 3 days, high priority and SLA-breached requests
SLA: on real working hours
Targets count against your working calendar and public holidays; the clock pauses while waiting for the customer. Risk shows before the breach.
- Different target times by priority, organisation or any query
- Automation rules that alert the manager and raise priority 30 minutes before a breach
Support packs and satisfaction
The support hours you sold are drawn down per request, and overage is visible. At every resolution the customer rates in one click without signing in; average, distribution and response rate are reported per project and organisation.
- The balance decreases in the same transaction as the resolution; a wrong draw-down is corrected with a reversing entry
- Customers see their balance on the organisation page in the portal
Requests and delivery on one chain
An agent escalates a request to a delivery task in one step. When all linked tasks are done the request resolves itself; nobody has to chase status.
- One user directory: the same person works in both products with one account
- One search: tasks, projects, customers and requests; everyone sees only what they are allowed to
Projects, Kanban and Scrum
Every project runs with its own key, workflow and team. The whole flow from sprint planning to close is in the product; reports build themselves from task history.
- Readable task keys such as MOB-58, with permanent links
- Workflow templates: you define the stages, approvals and transitions
- Burndown, velocity and epic progress reports
- Work added or removed mid-sprint is tracked separately in the report
Cost: every hour and every expense
No separate costing tool is needed. Time logged on tasks and approved expenses turn into the real project cost automatically; budget use, profit amount and margin are tracked together.
- Drill from the overall picture to department, project, person and a single task.
- Expenses go through an approval flow; the submitter and the approver cannot be the same person.
- Meetings are cost too: the cost of a project meeting is posted to project expenses.
- Only authorised roles see salary data.
Ask your company knowledge
The AI assistant searches your documents, projects and tasks; links to the file, project and task it relied on sit under the answer. Text is extracted from uploaded PDFs, Word files and images (OCR), summarised and prepared for semantic search.
- The assistant only draws on records the person asking can access.
- The daily brief is ready every morning: events of the day, visible work status and recommendations.
- Natural-language reports: you type a sentence and get a query and chart draft; you have the final say.
Automation and dashboards
Hand repetitive work to rules built without code: when, if, then. Every run lands in the audit log. Dashboards start from a template, are arranged by drag and drop, shared with the team and shown on a wall screen.
- Triggers: record event, schedule, SLA threshold
- Click a number on a dashboard to open the matching request list
Access, security and deployment
There is a six-level role model, with groups and project roles; for anyone not allowed to see it, a record simply does not exist. Active Directory / LDAP sync, two-step verification and an audit log are in the product. You can use it in the cloud, or install it under licence on your own servers and keep data on your infrastructure.
- Personal data masking, anonymisation and versioned consent texts
- Every query is bound to the workspace; workspaces are isolated from one another
Moving from Jira
Your Jira backup is imported directly; the team keeps working with the keys, history and queues it knows. The wizard first reports what will be created, updated or skipped; then it writes phase by phase and verifies with counts and samples.
- Projects, requests (with the same numbers), comments, attachments and change history are migrated
- Running the same backup again creates no duplicates
Meeting rooms and vehicle fleet
The room calendar prevents clashes and computes what each meeting costs in participant time. Company vehicles are managed through a recorded request, approval and assignment flow, not by email and phone.
Team health and performance
Signs of overload and sustained pressure are scanned regularly and flagged to the manager. A regularly computed performance score goes through manager approval, and employees can appeal. There is a separate, permission-protected escalation channel for sensitive issues.
Illustrative screens are prepared to explain what the product does; they contain no real institution, person or outcome data.
The tools it connects to
OpsQI talks to the tools you already use and exposes its events outward.
Code repositories
- GitHub
- GitLab
Repository connection and pull request review, including self-managed GitLab.
E-mail
Incoming mail becomes a request; outgoing notifications carry your brand and can be replied to.
Directory services
- Active Directory
- LDAP
Users and groups sync on a schedule; an account disabled in the directory loses access and sessions.
Webhooks
Work events are sent to your own systems via signed webhooks.
Advanced search
- Elasticsearch
Optional; provides fast, Turkish-aware search at scale.
AI provider
A model credential is configured per workspace; usage is tracked by quota.
The journey of a request
- The customer raises a request via the portal or by email.
- The agent links the request to a new or existing task.
- The team delivers the task through the project, board and sprint as usual.
- When all linked tasks are done, the request is resolved.
- An email goes out to the customer with a satisfaction survey.
Frequently asked questions about OpsQI
Is OpsQI one product or two?
It is two products on one platform: Work Management and Service Desk. They share the same users, permission model, automation and AI layer; product access is granted per seat.
What data does the AI see?
It only works with data the user is allowed to see; it is switched on per workspace and subject to quota. On dashboards the engine computes the numbers and the model interprets them: a claim that cannot be tied to a computed metric or a sample request is dropped.
Can we install it on our own servers?
Yes. OpsQI can be used in the cloud or installed under licence on your own servers, in which case data stays on your infrastructure.
How do we move from Jira?
Your Jira XML backup is selected as the source. The wizard reports what it will do before anything is written, applies it phase by phase and resumes where it stopped if interrupted. Projects and keys, requests, comments, attachments, change history, workflows, SLAs, queues, saved filters, dashboards, automation rules and users are migrated.
Which systems does it integrate with?
On the code side GitHub and GitLab (including self-managed GitLab); Active Directory and LDAP for users and groups; the email channel; signed webhooks; optional Elasticsearch search. For AI, a model credential is configured per workspace.
How is cost calculated?
The hourly rate is the monthly salary divided by monthly working hours. Labour cost is logged time multiplied by the hourly rate. Total cost is labour plus approved expenses; profit or loss is revenue minus total cost.
Which languages is the interface in?
The interface is in Turkish and English.
How does pricing work?
The price is not published on this page. Product and service scope is defined in a meeting, and the price is set according to that scope. The first step is a live demo; then a pilot is set up in the cloud or on your servers, and the roll-out proceeds in stages.
Let's evaluate OpsQI together.
See it with your own data. Let us walk through your scenario in the product in a live demo; then start with one pilot team and one support project.
Let's talk